Downsampling with GDAL in python
Quite often, one wants to generate some data at high resolution (say process some image or images) and then calculate some relevant spatial statistics at some other resolution. For example, you might want to process Landsat TM data at 30m resolution, and might want to aggregate it to a resolution of 500m or so to compare with MODIS. The aggregation needs to be defined: do you want to use a simple average, or maybe the mode is more informative? Perhaps the median is more robust to outliers? Do you want to consider stuff like variance? At any rate, it is possible to do all this with Python and the GDAL bidings.
The scheme I propose is to create an in-memory raster dataset with the high resolution data that we want to process. Then we use then gdal.RegenerateOverviews function to do the downsampling.
def downsample_output ( g, fname_out, hires_data ):
      """This function downsamples, using the **mode**, the 2D array
      `hires_data`. The datatype is assumed byte in this case, and
      you might want to change that. The output files are given by
      `fname_out`, and we downsample by a factor of 100 and 300. The
      initial GDAL dataset is `g` (this is where the data are coming
      from, and we use that to fish out the resolution, geotransform,
      etc.).

      NOTE that this is fairly specialised a function, and you might
      want to have more flexiblity by adding options to deal with
      the aggregation procedure in `gdal.RegenerateOverviews`, the
      resolutions of the aggregations you want, the datatypes, etc.
      """
      # Create an in-memory GDAL dataset to store the full resolution
      # dataset...
      total_obs = g.RasterCount
      drv = gdal.GetDriverByName( "MEM" )
      dst_ds = drv.Create("", g.RasterXSize, g.RasterYSize, 1, \
          gdal.GDT_Byte )
      dst_ds.SetGeoTransform( g.GetGeoTransform())
      dst_ds.SetProjection ( g.GetProjectionRef() )
      dst_ds.GetRasterBand(1).WriteArray ( hires_data )

      geoT = g.GetGeoTransform()
      drv = gdal.GetDriverByName( "GTiff" )
      resampled_3k = drv.Create( "%s_3k.tif" % fname_out, \
          g.RasterXSize/100, g.RasterYSize/100, 1, gdal.GDT_Byte )
      resampled_9k = drv.Create( "%s_9k.tif" % fname_out, \
          g.RasterXSize/300, g.RasterYSize/300, 1, gdal.GDT_Byte )

      this_geoT = ( geoT[0], geoT[1]*300, geoT[2], geoT[3], \
              geoT[4], geoT[5]*300 )
      resampled_9k.SetGeoTransform( this_geoT )
      resampled_9k.SetProjection ( g.GetProjectionRef() )

      this_geoT = ( geoT[0], geoT[1]*100, geoT[2], geoT[3], \
              geoT[4], geoT[5]*100 )
      resampled_3k.SetGeoTransform( this_geoT )
      resampled_3k.SetProjection ( g.GetProjectionRef() )
      resampled_3k.SetMetadata ({"TotalNObs":"%d" % total_obs})

      gdal.RegenerateOverviews ( dst_ds.GetRasterBand(1), \
          [ resampled_3k.GetRasterBand(1), \
          resampled_9k.GetRasterBand(1) ],
          'mode' )

      resampled_3k.GetRasterBand(1).SetNoDataValue ( 0 )
      resampled_9k.GetRasterBand(1).SetNoDataValue ( 0 )
      resampled_3k = None
      resampled_9k = None
Here's how the above code works on resampling some 30m Landsat TM/ETM+ data
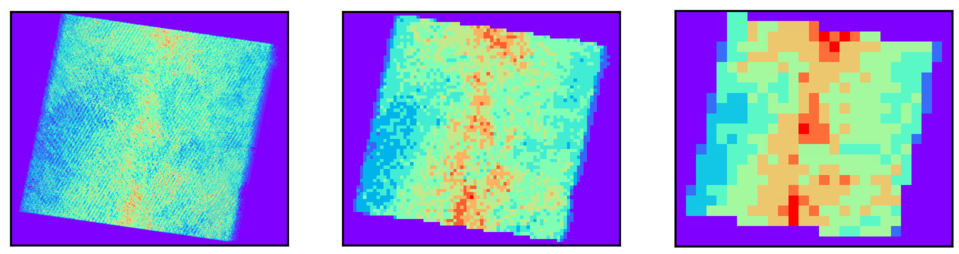
The left handside plot shows the original 30m resolution dataset. The middle plot shows a 3km modal aggregation, whereas the right handside plot shows a 9km modal aggregate.