Creating a country raster mask using GDAL
Usually, we remote sensing types ignore country boundaries: they don't really make much sense, as they are not aligned with MODIS pixels ;-) However, I was asked what's the easiest way to produce a global mask of countries, so that all th grid cells (say at 0.5 degree resolution) that fall within a country are given the same number. I guess the easiest thing would be to use QGIS, add a new layer with the offending name ($id is the field you are looking for there!), and then rasterise the layer.
But how do to you that with GDAL? We can use gdal_rasterize for this, and I assume that you are using 1.8.0 or later. Let's say we use the ubiquitous world shapefile. We need to create a single integer tag for each feature or country. The best of doing this is to use GDAL's virtual variable FID. However, you need to create the field on the fly, as it were: you use the -sql statement, and add the FID variable that way (see this. We also need to specify the extent of the raster output file. We'll oversample a bit to start with
gdal_rasterize -of GTiff  -a FID  -sql "select FID, * from world"  \
  -te -180 -90 180 90 -tr 0.05 0.05 -a_srs "EPSG:4326" -a_nodata 0 \
  -ot UInt16 world.shp world_grid.tif
So, that gives us world_grid.tif
$ gdalinfo world_grid.tif -stats
Driver: GTiff/GeoTIFF
Files: world_grid.tif
Size is 7200, 3600
Coordinate System is:
GEOGCS["WGS 84",
    DATUM["WGS_1984",
        SPHEROID["WGS 84",6378137,298.257223563,
            AUTHORITY["EPSG","7030"]],
        AUTHORITY["EPSG","6326"]],
    PRIMEM["Greenwich",0],
    UNIT["degree",0.0174532925199433],
    AUTHORITY["EPSG","4326"]]
Origin = (-180.000000000000000,90.000000000000000)
Pixel Size = (0.050000000000000,-0.050000000000000)
Metadata:
  AREA_OR_POINT=Area
Image Structure Metadata:
  INTERLEAVE=BAND
Corner Coordinates:
Upper Left  (-180.0000000,  90.0000000) (180d 0' 0.00"W, 90d 0' 0.00"N)
Lower Left  (-180.0000000, -90.0000000) (180d 0' 0.00"W, 90d 0' 0.00"S)
Upper Right ( 180.0000000,  90.0000000) (180d 0' 0.00"E, 90d 0' 0.00"N)
Lower Right ( 180.0000000, -90.0000000) (180d 0' 0.00"E, 90d 0' 0.00"S)
Center      (   0.0000000,   0.0000000) (  0d 0' 0.01"E,  0d 0' 0.01"N)
Band 1 Block=7200x1 Type=UInt16, ColorInterp=Gray
  Minimum=1.000, Maximum=243.000, Mean=166.683, StdDev=76.175
  NoData Value=0
  Metadata:
    STATISTICS_MINIMUM=1
    STATISTICS_MAXIMUM=243
    STATISTICS_MEAN=166.68288288267
    STATISTICS_STDDEV=76.17549545167
Cool, so how do we create a say 0.5degree grid from our 0.05degree grid? gdaladdo can help building overlays with a spatial resolution given as integer multiples of 0.05 degrees. Within that new resolution, we can take the mode of the 0.05 degree grid, and use that to label the new lower resolution grid. Further assume that we want a 0.5 degree and a 1 degree grid out
gdaladdo -r mode world_grid.tif 10 20
gdal_translate -of GTiff -outsize 720 360 world_grid.tif world_grid_hd.tif
gdal_translate -of GTiff -outsize 368 180 world_grid.tif world_grid_1d.tif
And here you have a picture of how it looks. I'm using a random colormap with matplotlib (see here)
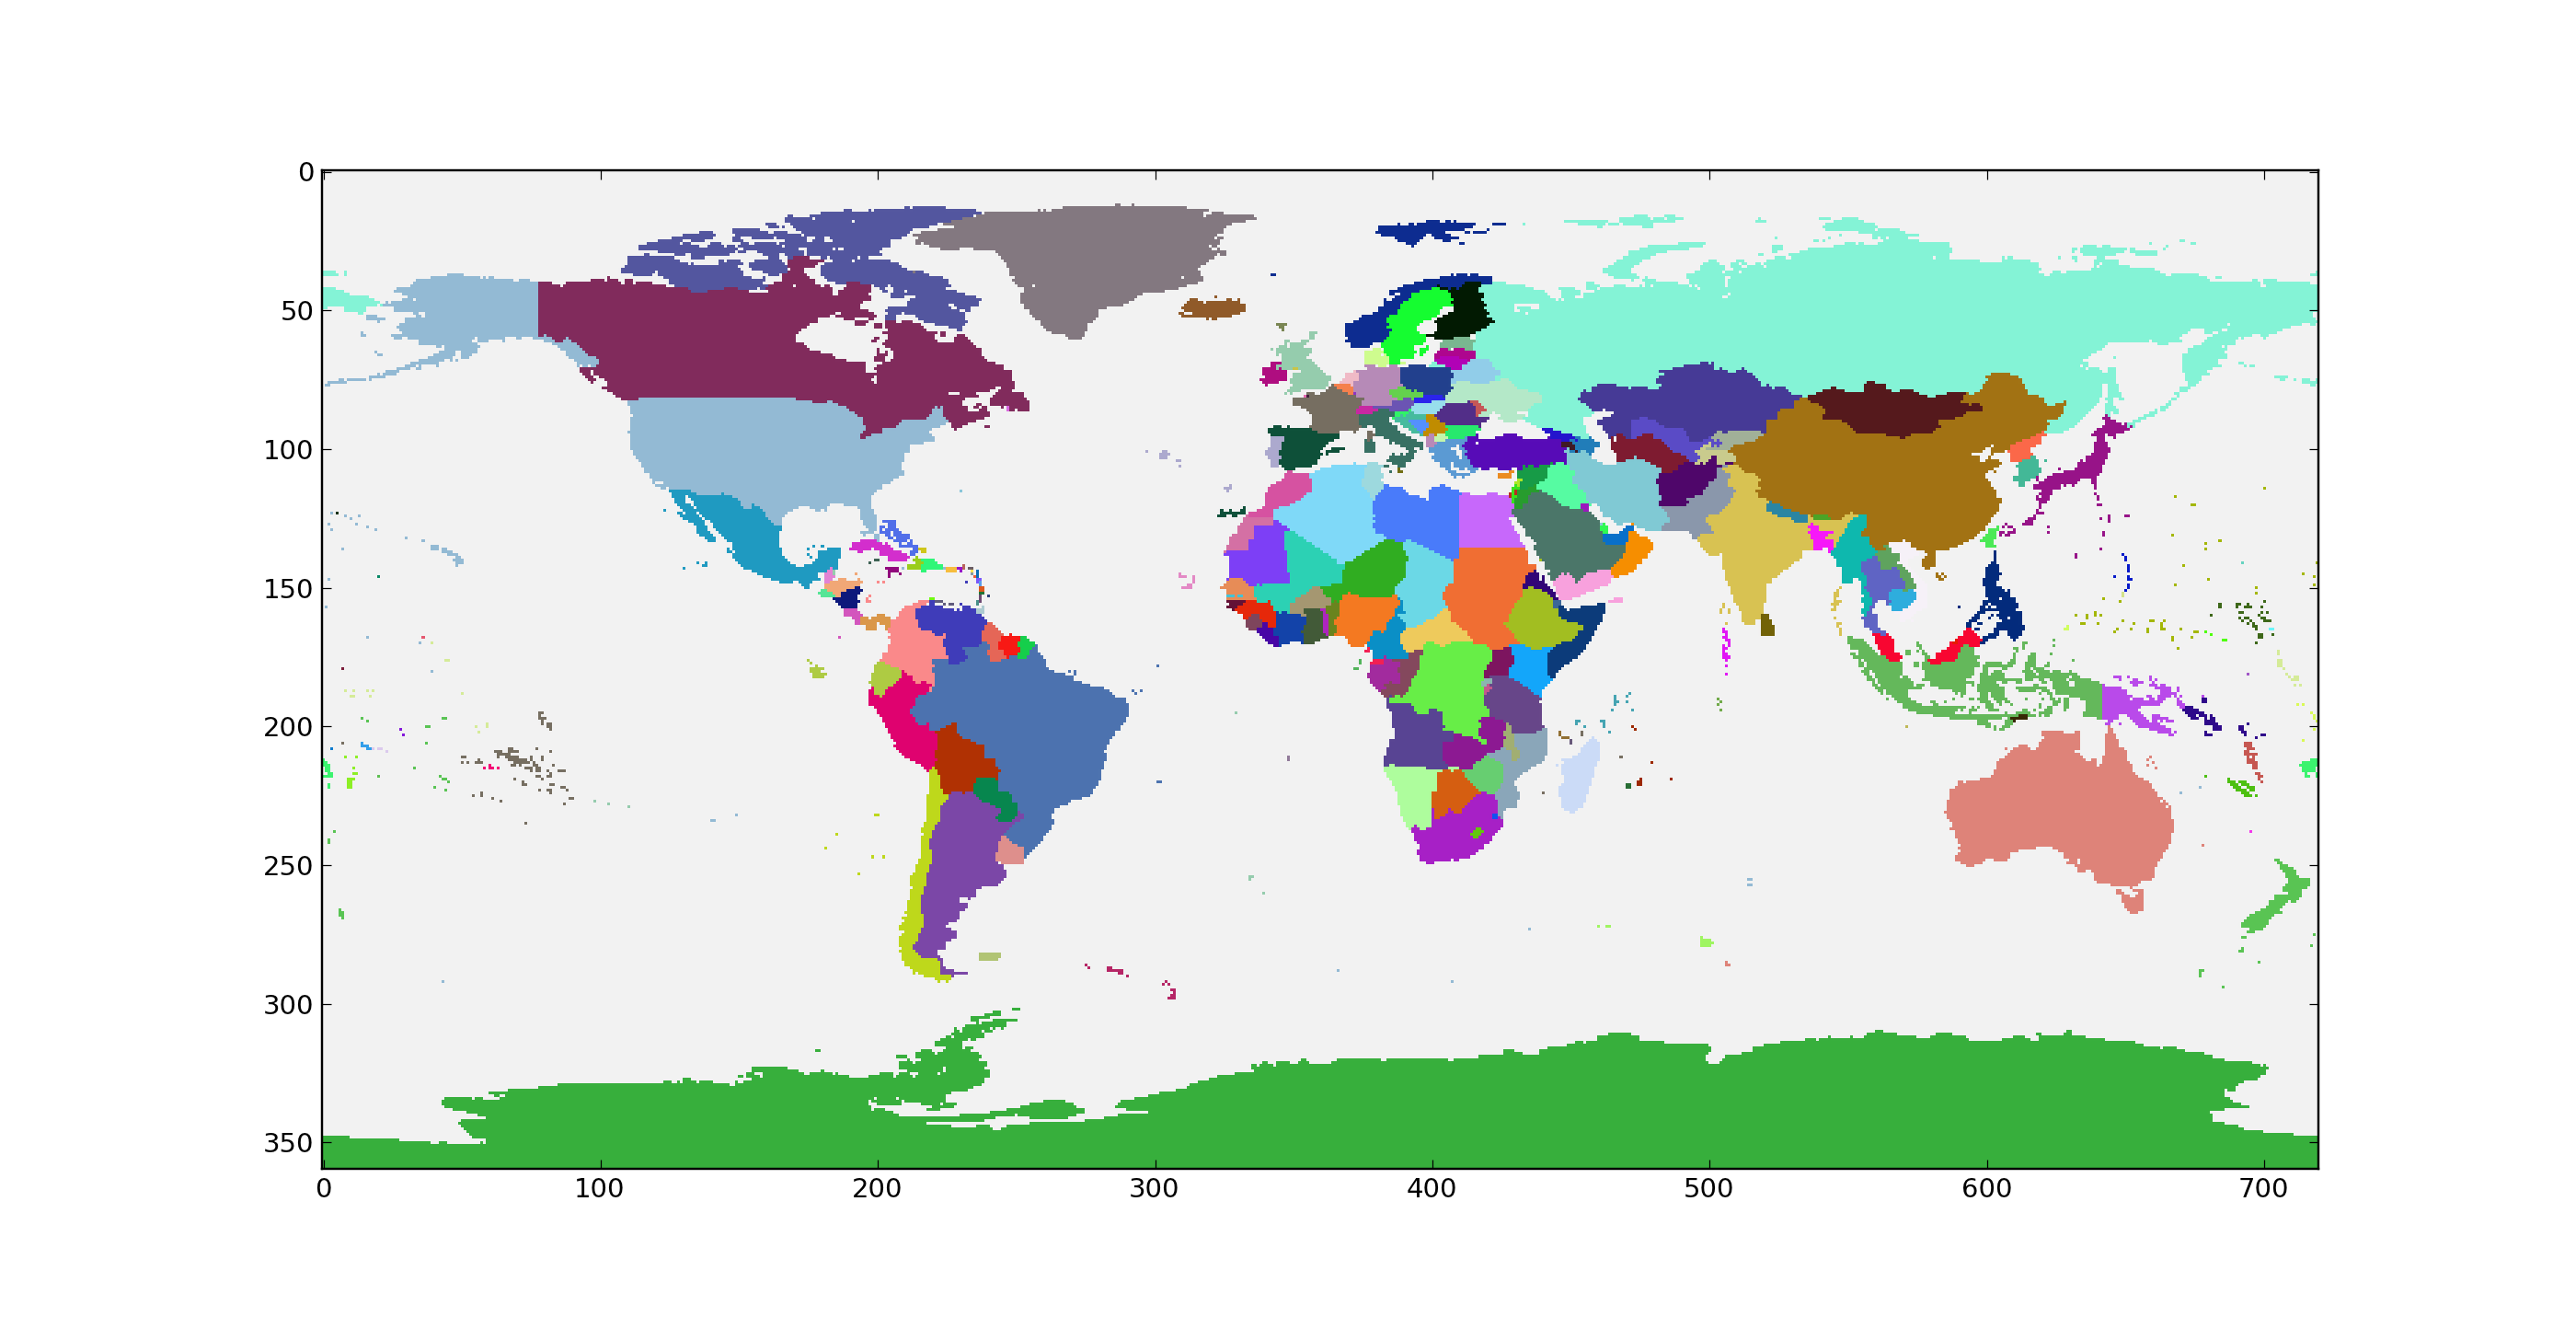
The map, in all its glory.