Simple time series MODIS data analysis
In a previous post, I demonstrated how to stitch and put together a number of MODIS data files. This is useful and interesting, but in the end, we are interested in analysing the data we get out of the satellite. One first way around this might be to extract time series from pixels in the region of interest that share some common feature (such as common landcover, or where we just happen to have some ground data). In this post, I will demonstrate how to extract data for common landcover pixels. To do this, I will use the MODIS landcover product, as that's the only one I have lying around. Note that in reality, one would just stay in the MODIS projection for this, rather than waste time reprojecting and clipping things. However, one could think that the landcover map is in a different projection.
The procedure for this is quite straightforward:
- Open and read in the reference dataset (landcover in our case)
- Loop over time, grabbing all the individual rasters for each period
- Loop over the features we are interested in in the reference dataset
- Calculate some descriptive stats for the given time period & feature
- Do some plotting
Here, we shall loop over the different landcover types, and for each timestep, we will calculate the mean and standard deviation of GPP. A script:
#!/usr/bin/env python
"""
A script to grab timeseries from MODIS data using GDAL and python
Author: J Gomez-Dans/NCEO & UCL
"""
__author__: J Gómez-Dans

import numpy as np
import matplotlib.pyplot as plt
from osgeo import gdal

plt.ion()
# Read in the landcover data
g = gdal.Open( "modis_lc1.tif" )
lc = g.ReadAsArray()
# The different landcover types we are interested in
lc_labels = {1: "Evergreen Needleleaf forest",
2:    "Evergreen Broadleaf forest",
3:    "Deciduous Needleleaf forest",
4:    "Decidious Broadleaf forst",
5:    "Mixed forest",
6:    "Closed shrublands",
7:    "Open shrublands",
8:    "Woody savannas",
9:    "Savannas",
10:   "Grasslands",
11:   "Permanent wetlands",
12:   "Croplands",
14:   "Cropland/Natural vegetation mosaic"}
# Time axis
doys = np.arange ( 1, 365, 8 )

t_axis = np.array( [ 730486. + doys + 365*i \
for i in xrange(10)] ).flatten()
iplot = 1
# Loop over landcover types
for ( class_no, class_label ) in lc_labels.iteritems():
# The landcover filter for this class is calculated now.
passer_lc = ( lc==class_no )
print class_label
n_years = 0
plt.clf()
# Remember to clear the screen
mean_gpp = []
std_gpp = []
# The lists above will hold the time series
# Now loop over years
for year in xrange ( 2002, 2012 ):
    print year
    # Open the relevant file
    g = gdal.Open ( "MOD17A2.%04d.tif" % year )
    # For eacth time step (ie band)...
    for tstep in xrange ( g.RasterCount ):
        # Read the data. Note bands start @ 1 in GDAL, not 0
        gpp = g.GetRasterBand ( tstep+1 ). ReadAsArray ()
        # Scale and filter wrong values
        gpp = np.where ( gpp >= 30000, np.nan, gpp*0.0001 )
        # Filter, where the data are OK, and the landcover is
        # the one we stipulated above
        passer = np.logical_and ( np.isfinite( gpp ), \
                passer_lc)
        # The pixels that get selected from this date.
        work = gpp[ passer]
        # Calculate means and standard deviations
        mean_gpp.append ( work.mean() )
        std_gpp.append ( work.std() )
# At the end of all years, do some plotting
plt.fill_between ( t_axis, np.array(mean_gpp) -  \
    np.array(std_gpp), np.array(mean_gpp)+ np.array(std_gpp), \
    facecolor="0.8" )
plt.plot ( t_axis, np.array( mean_gpp ), '-r', lw=1.2)
ax = plt.gca()
ax.xaxis_date()
plt.title ( "%s" % class_label )
plt.grid ( True )
plt.xlabel ("Time")
plt.ylabel (r'GPP $[\frac{kg C}{m^2}]$' )
iplot = iplot + 1
print "Saving"
plt.savefig ( "lc_%02d.png" % class_no, dpi=150 )
plt.savefig ( "lc_%02d.pdf" % class_no )
print "\tSaved..."
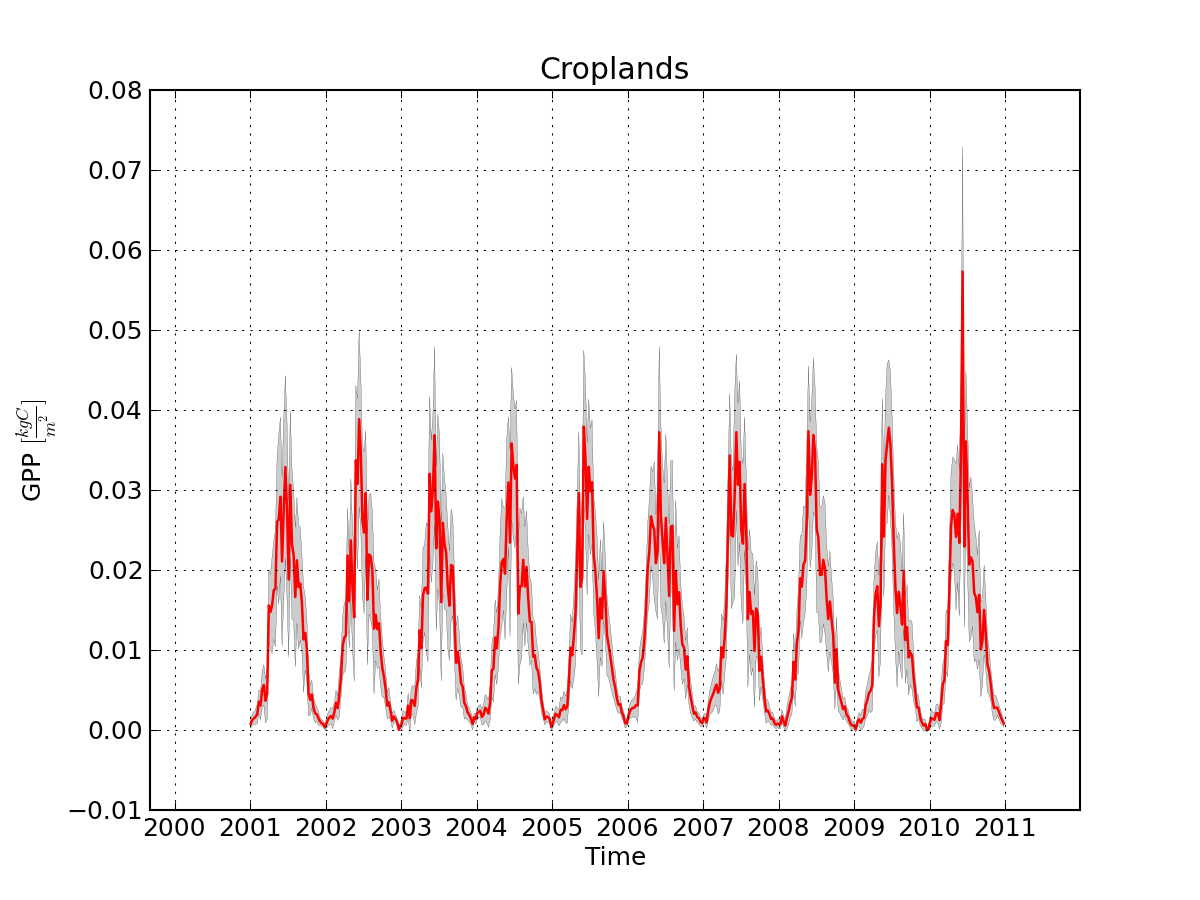
A time series of GPP over the UK (& Ireland, and bits of France, Belgium, etc!) for what the MODIS landcover products claims to be "Croplands" )
Cool, hey? ;-)